Introduction
If you are looking at this post "enabling diagnostics logging" then you are already familiar with building and hosting web application with in a azure app service. You may also be looking for options to support your application.
I will show how to use diagnostics logs that are available with in azure app service. I will show the options available to configure diagnostics logs.
Reasons for logging
There are various reasons why we log information. However, we should not log for each and every scenario in our application which then creates too much of information from which an useful information can be taken.
To mitigate this problem, Logging Strategies are in place to clarify what, when and why something should be logged.
Most important logging strategies are listed below.
Auditing
This type of information helps to find who has logged in and who performed a particular action in business context. This acts as tracking mechanism.
Detecting Suspicious Activity
Auditing helps in determining any Suspicious Activity by hackers to break into your system by many login attempts or SQL injection, XSS and etc.
Performance Monitoring
Useful logs created to perform an baseline performance and to see whether application is performing as expected.
Error Notification
Generated error logs are useful in timely notification to the team to inform error occurred and you can act accordingly.
Tracing
To troubleshoot issues that do occur in your application, trace messages can be added to the application logic that helps to create path that user has navigated to reach to your application.
Difference between enabling diagnostics logging and application insights
Diagnostic logs has built-in diagnostics to assist with debugging an App Service web app. It can only track just the app Service instance and allow basic log viewing and downloading.
It does supports trace messages and will not capture AI trace or Exceptions from your application. All the logged data are available in files that needs to be manually analysed. This logging affects web app performance.
Application Insights, a feature of Azure Monitor, is an extensible Application Performance Management (APM) service. It can trace across all the layers in a web application and has enhanced analytics. Also, application insights has SDK with enhanced custom telemetry. E.g. Exceptions and traces plus Pageviews, Events and Metrics.
App insights can also capture diagnostics trace messages. Compared to diagnostics logs, the impact on your app's performance is very small.
Read more about application insights
You might feel by now that we can go with application insight instead of leaning diagnostics log. You might be here to learn about diagnostics log as this is part of azure AZ-203 certification skill assessment.
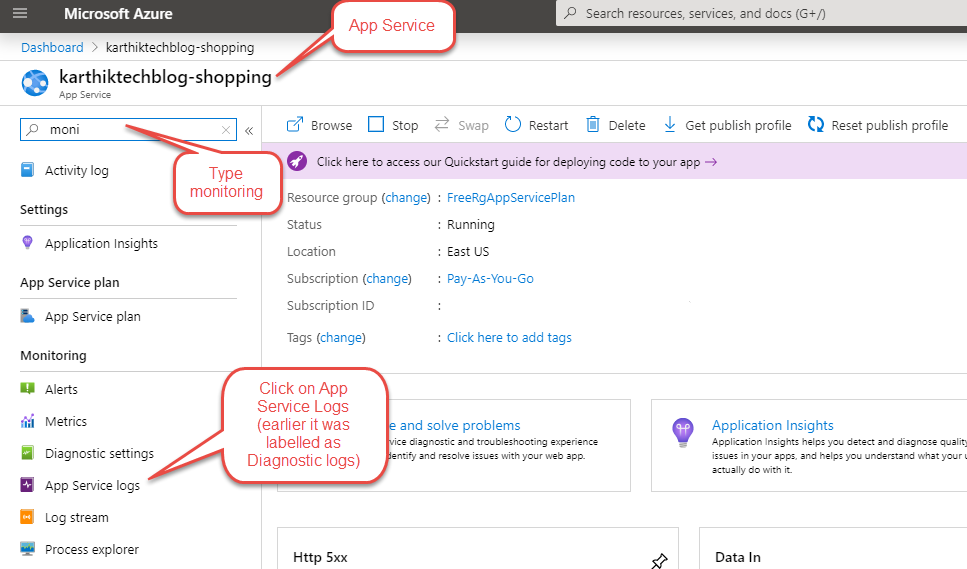
To configure the logging, go to your app service and search with keyword "Monitoring" as shown in the below image. You will see "App Service Log" menu in the left side menu.
Types of Diagnostic Logs
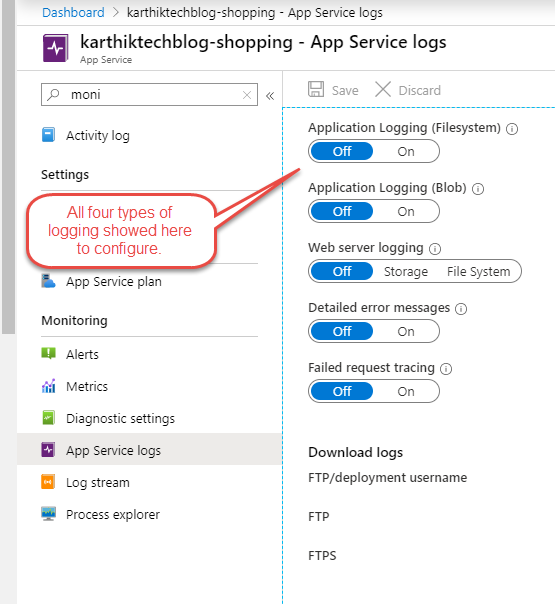
There are four types of diagnostics logging namely
- Application Logging
- Web Server Logging
- Detailed Error Message
- Failed Request Tracing
Application Logging:
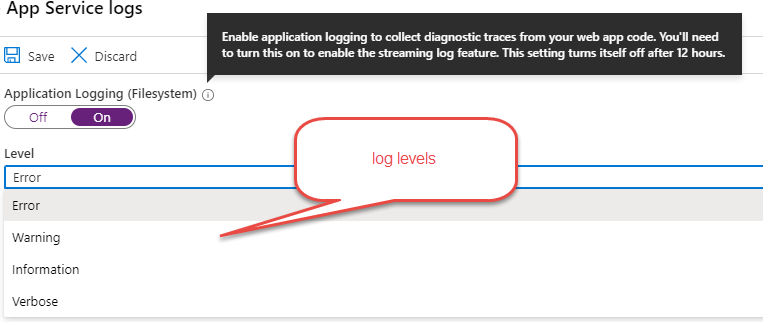
Application logging is the place where the coded trace message can be viewed. Each trace messages give specific log level.
Log Levels
- Off
- Error
- Warning
- Info
- Verbose
You can see that each log level has been given a level number to it, you can choose this level when configuring the application log to see the highest level of logging.
For example, if you choose Warning when configuring, then the Info and Verbose are ignored.
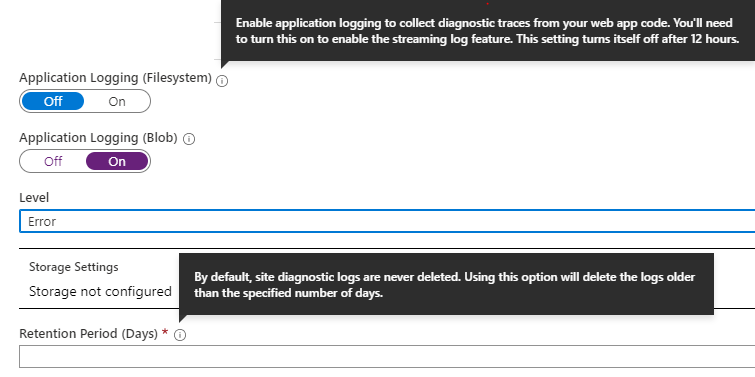
Application Logging (Blob)
You can store the log in Blob. If you wish to choose, then you need to create a container first and then use it.
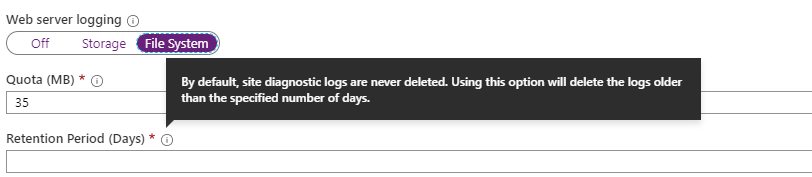
Web Server Logging:
This contains the Raw HTTP data, like IIS logs that helps to capture the URI, client IP address, port, browser and much more for troubleshooting.
Quota option is used to configure the space used to store the logs.
Retention period option will delete the logs older than the specified number of days.
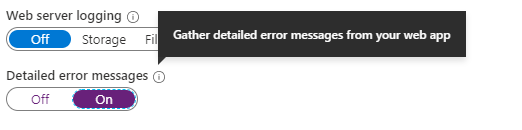
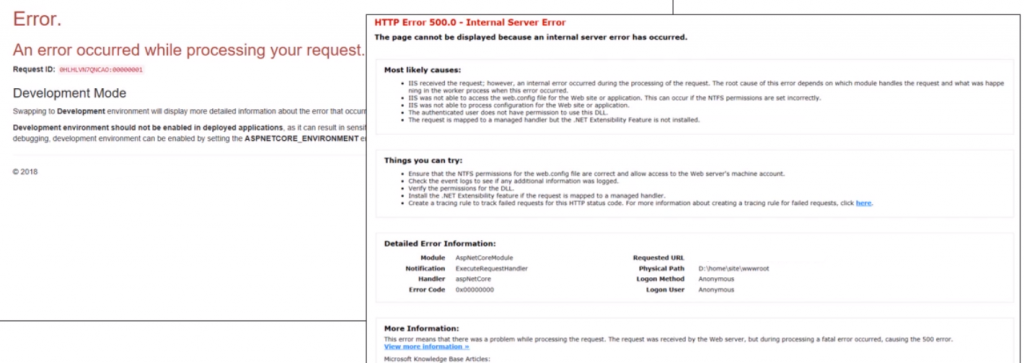
Detailed Error Message:
With custom error response, you can hide the server error response. For example, when there is an 500 - Internal server error occurs, the use gets to see custom error page that is configured instead of seeing server error page.
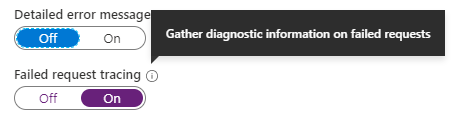
Failed Request Tracing:
This is a detailed error logging that shows almost all the logs that you can trace and find the cause of error.
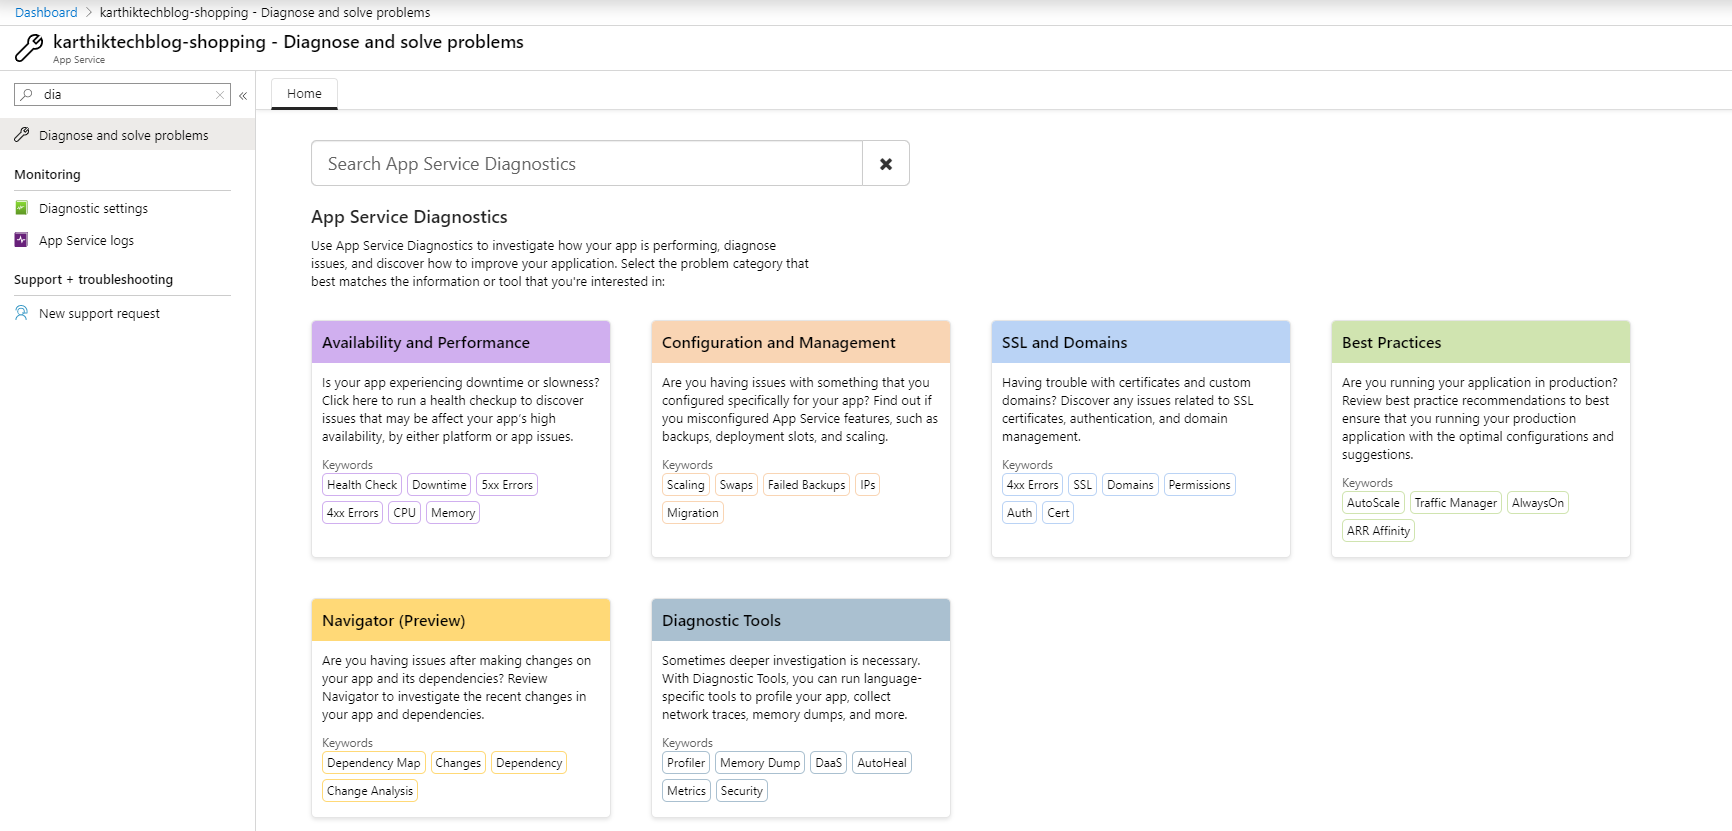
Diagnose and Solve Problems
There are different types of App Service Diagnostics available. You can choose one or more from the listed options. Each option is useful in its own way of solving problems.
Conclusion
In this post, I showed enabling diagnostics logging in app service and showed various options that are available for Azure App Service. The details in this post will help to cover a part of knowledge required to complete Azure AZ-203 certification.
That’s all from this post. If you have any questions or just want to chat with me, feel free to leave a comment below.